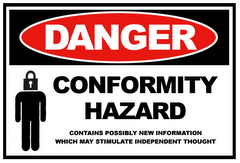
"Human beings never think for themselves, they find it too uncomfortable. For the most part, members of our species simply repeat what they are told--and become upset if they are exposed to any different view. The characteristic human trait is not awareness but conformity...Other animals fight for territory or food; but, uniquely in the animal kingdom, human beings fight for their 'beliefs'...The reason is that beliefs guide behavior, which has evolutionary importance among human beings. But at a time when our behavior may well lead us to extinction, I see no reason to assume we have any awareness at all. We are stubborn, self-destructive conformists. Any other view of our species is just a self-congratulatory delusion." - Michael Crichton, The Lost World

Sunday, March 4, 2007

Do you Think Like a Trader?

Take 1 – The Idiot

A penniless bum walks in to a bar and sees a sign on the wall and jumps for joy. Before the bartender can ask him what he wants he says ‘I’ll see you tomorrow’ and leaves.

Take 2 – The Norm

A man walks in to a bar and sees a sign on the wall and smiles. The bartender asks him what he wants. The man says ‘A pint of beer please’. The bartender gives him his beer, the man drinks it, pays, and leaves.

Take 3 – The Trader

A trader walks into the same bar, sees the sign, and gets a sly grin on his face. The bartender asks him what he wants. He says ’How much is beer?’ The bartender says $5 a pint.

The trader says ‘No, not how much I have to pay, how much do you pay for beer?’

‘Why should I tell you that?’ says the bartender.

‘I’ll make it worth your while’ says the trader.

‘OK’ says the bartender ‘I pay $2.50 a pint, now what do you want?’

‘I want to sell you some beer at $2 a pint’ says the trader.

‘How much beer?’ the bartender asks.

‘As much as you can take’ says the trader.

‘Where is it?’ says the bartender.

‘Oh, I don’t actually have any beer, I just want to agree to sell you some’.

‘You’re drunk or insane’ says the bartender ‘Get out of my bar’.

The trader leaves in disgust muttering something about the misleading sign.

Question: What did the sign say?

Contact Us if you can’t work out the answer.

Paul King
PMKing Trading LLC
www.pmkingtrading.com

Monday, February 26, 2007

Judgmental “Heuristics” Or Biases and Developing Your Trading System, Part Three.

So far in this series, we have looked at biases regarding randomness, which is the tendency people have to seek patterns where none exist and to invent the existence of unjustified causal relationships. Because people attempt to understand and make order out of the market, they assume that the longer a trend continues, the more likely it will suddenly turn around. This manifests into the "gamblers fallacy," which is a very common trap that traders fall in to and lose money when they do. And, last week we examined data reliability as it relates to the degree to which information reflects what is really happening. We focused on the representation bias, availability bias, anchoring bias, and hindsight bias.

Today we continue with four common misuses of sampling variability in relation to system development, and finish with some tips to help overcome all of these biases.

Sampling Variability. Most people misuse the basic concepts of sampling theory in making predictions and designing trading systems. The first principle, which is highly abused, is that you can make more accurate estimates of the true population probability from larger samples than from smaller samples. In other words, you can get a much more accurate estimate of the reliability of a trading signal from a large sample than from a small sample. In our earlier example, Jack said that his pattern predicted a higher market price 35% of the time. The accuracy of his estimate would be much better if it were based on 100 measures of the pattern than if it were based on 20 measures. Unfortunately, most people follow a bias called the law of small numbers. Once they observe a phenomenon occurring a few times, they believe they understand it and know its likelihood.

People tend to form their opinions based on a few cases, and fail to revise their opinions upon the receipt of new data to the extent that they should, based on probability theory. Traders tend to stick to their old opinions rather than updating them as new information becomes available.
We call this the conservatism bias. This points out the importance of doing a thorough, objective testing of your market observations on a set of data that is different from the data in which you made the observation.

Traders want consistent information from various sources, such as three oscillators based upon the same data (which of course are likely to show similar results). However, this consistent information will lead to increased confidence, but not to increased accuracy of prediction.
We call this the consistency of information bias. What it means is that traders are likely to add more indicators in order to get more consistent information so they can feel confident about it. But adding more indicators is not likely to give one more accurate information. This points out the importance of developing a simple, robust trading system.

A fourth major misuse of sampling variability is that people fail to understand that the amount of variability in a sample is positively related to the degree of randomness in the sample. Once you have observed a relationship in a set of data, it is no longer random with respect to that relationship. The more relationships you observe with respect to various parameters in the data, the less random the data is with respect to those parameters. Unfortunately, system developers frequently make this mistake when they use a sample of data to optimize a system and then test the system on the same data. Once a set of data has been used to optimize a system’s parameters, then it is not random with respect to those parameters. As a result, when you use the same sample of data to test the system, you can expect it to do well in the test, but this has nothing to do with how it will work as a system trading real money. Data must be tested on a sample that is independent from the sample used to observe the original relationship.

How to overcome judgmental biases

You probably cannot totally overcome the effect of the various judgmental biases. One reason is that one of the most prevalent biases is the ego bias in which people decide, “Yes, I understand all of this, but it applies to other people, not to me. I’m a very special person and it doesn’t apply in my case.” Nevertheless, if you are willing to assume you are human and that these biases do apply to you, then you can take steps to minimize their impact.

Remember, your job as a trader is to find an edge in the markets. You must capitalize on that edge, so you will make money in the long run, while doing everything possible to preserve your capital in the short run. As a result, I strongly recommend that you spend a lot of time writing down your objectives and designing something to meet those objectives.

What is an objective?

Your objective is your goal, your target. It is the thing that you want to attain or accomplish.
Objectives set the roadmap for the entire system development process. How would one know how to get someplace if they didn’t know where they were going first? It is easy enough to see that if one trader had an objective such as “I want a system that trades long-term stocks, that requires my attention only once each week and makes 20% per year” compared to a trader’s objective that was “I want to actively trade my mother’s retirement account for four hours each day, without holding overnight positions” then two completely different systems would be required. The objectives or goals are very different. There are endless configurations of objectives. The point is you need to specifically know what it is that you are trying to attain; and only then can you develop a trading system that will help you attain it.

Observe the markets as an artist would. Be creative. Determine relationships in the market that occur over a wide variety of markets and market conditions. Remember, you are not trying to explain the markets, but just determine some market relationships you can capitalize upon. The more widespread the relationship—does it occur in different markets and different types of markets—the more likely you will be able to profit from it.

Be willing to be unique. Think about how you can best represent the price of the market. Notice relationships in the patterns of price movement that you can capitalize upon. Once you have observed some relationships, figure out how to measure them. If you can avoid common indicators, then you probably have a real edge.

Simple is probably better. Why? Because the more complex the relationship, the more likely it is to be unique to particular markets and the less likely it is to make you money.
Be sure you understand the edge the relationships you observe in your data give you. Do your observations make sense? How do they give you an edge? Also be sure that you can write down your observations in enough detail so you can recognize them as they occur and not just in hindsight.

Understand money management so you can capitalize on your observations. Trade according to a predetermined plan rather than your emotions.

Be sure to objectively test your observations on extensive market data that is different from the data you used to observe the relationships in the first place. Objective testing is very important because with subjective testing you will tend to see what you want to see. In other words, the market will confirm your expectations.

Many of the psychological issues described in this article are covered in my How to Develop a Winning Trading System that Fits You workshop and home study program. These programs will help you clarify your objectives, and then show you how to design a trading system to meet those objectives.

About Van Tharp: Trading coach, and author Dr. Van K. Tharp, is widely recognized for his best-selling book Trade Your Way to Financial Fre-edom and his outstanding Peak Performance Home Study program - a highly regarded classic that is suitable for all levels of traders and investors. You can learn more about Van Tharp at www.iitm.com.
Sunday, February 25, 2007

Judgmental “Heuristics” Or Biases and Developing Your Trading System, Part Two.

Last week we looked at the randomness bias, which is the tendency people have to seek patterns where none exist and to invent the existence of unjustified causal relationships. Because people attempt to understand and make order out of the market, they assume that the longer a trend continues, the more likely it will suddenly turn around. This manifests into the "gambler's fallacy" which is a very common trap that traders fall in to and lose money when they do.

This week we will cover the topic of data reliability and biases that come up in this area.

Reliability. When people obtain information, they fail to assess how reliable their data is, where reliability refers to the degree to which information reflects what is really happening. What traders observe in the market, with the possible exception of floor traders and other market makers, is not the market, but some sort of visual representation of the market. Thus, you are responding to a bar chart or a candlestick chart, or a point and figure chart, or to a representation of the market profile, etc.—and not to the real market. Furthermore, few people make decisions from that information alone. Instead, they distort the information even more by using indicators. These indicators are essentially shortcuts or heuristics that people have thought up to condense, organize and make sense of the data. Interestingly, there are hundreds of possible indicators—in fact, hundreds of thousands if you count various permutations and combinations—but most traders use only about 20 of the most common ones in their decision making.

Market information is certainly distorted, and thus less reliable, when it is transformed into various indicators. The less reliable the information is, the less value it has for predicting. Using our example from last week when Jack observed patterns in the market, reliability is a measure of how accurately Jack’s pattern actually predicts a sharp move in the market. Many people might notice a pattern or relationship in the market and then use it in developing a system without ever determining how reliable the relationship is. Accurately knowing how well the pattern predicts the move is very important information for any person wanting to develop a trading system.

A lot of the biases people have in their decision making tend to distort reliability in some way. For example, we have many biases keeping us from knowing the true probability of an event happening. The true probability refers to the actual probability of the event occurring as opposed to a statistical estimate of the probability from a small sample.

One such bias that keeps people from developing a good trading system is called the representation bias. We tend to imagine that what we see or expect to see is typical of what can and/or will occur. Thus, if you observe a pattern in the market, you expect it to occur. If you develop some concept about the market, you will look for data to support that concept in the market, and you will probably find it whether it exists or not.

Once again, if you do not test objectively, and understand the results of the testing, you will probably find that your observations, in developing a trading system, tend to confirm what you expect to find. Thus, the representation bias is particularly important when it comes to assessing various trading signals. Are you considering the true probability rate in assessing your indicator? That is, are you considering the percentage of time a particular indicator is followed by the predicted outcome? Probably not!

I cannot overemphasize enough that trading indicators are merely ways of representing things of interest. Does a significant chart pattern actually mean that buyers are about to dominant sellers, or vice versa, and produce a significant price change? Of course not! It merely represents the possibility such an event might occur. Thus, any indicators you develop for buying or selling in markets are your way of representing potential trading opportunities. It is not the opportunity per se. Yet most traders, because of this particular bias, act as if the indicators are what they represent. It is like the indicators (be they stochastic, RSI, or moving averages) start becoming reality, instead of a representation of a concept or a belief in your head. When you realize this, you will become much more attuned to what trading is all about and less concerned about indicators and understanding the market.

Another bias that keeps people from understanding the true probability of an event happening, and thus distorts its reliability, is called the availability bias. We make predictions based upon how available the information is to us instead of the true probability rate in the population. Thus, when you first start looking at the market, the data sample you use will determine what you observe. In addition, strong emotional experiences, which affect how strongly information stands out in our minds, tend to strongly bias our decisions.

When people start to develop an estimate of how much a trading system can earn in a year or how many winning trades it will have, or any other estimate of its reliability, they tend to start with a set point. They then make adjustments to that figure according to anticipated changes in conditions. The initial set point is called an anchor. The dangers associated with using anchors in our decision making about trading systems (or anything else) is called the anchoring bias.

The first danger is that you assume there is some relationship between the anchor and what you are predicting. For example, in order to predict the price of the market a year from now, you would probably start making your estimate with the anchor of today’s price. Over a short period of time it may be an accurate basis for beginning to make an estimate (i.e., today’s price is a good starting price for forecasting the price in two or three days), but over a longer period of time the strategy does not allow for the unpredicted or the unexpected. That is why one of the most important parts of developing a trading system is extensive planning. And this extensive planning should include a careful consideration of everything that might go wrong.

The second danger in the anchoring bias is that people make an assumption that the initial set point or anchor itself is meaningful. For example, if you use the results of your testing to predict future results, you are assuming that those results are meaningful and will not change dramatically over time. This is probably true if your testing data is different from the data you used to develop the system and included enough samples to make future estimates reliable. But those are big “ifs.”

Another bias that tends to have a significant effect on trading decision-making is hindsight bias. People tend to see relationships in the market after they occur, and then assume they knew it all along. It’s very easy to point out such a relationship after it occurs. I’ve worked with a number of clients who claim that they cannot follow their signals. However, what tends to happen is that they do not recognize the signals while they occur. Instead, they see many possibilities in the data. But once the signal is complete, it is too late! They then criticize themselves for not taking it when it occurred. The typical response is, “I knew it all along. Why didn’t I take that signal?”

This problem will not occur if you write down your criteria for a signal in enough detail so that it could be entered into a computer. You can then make a checklist for your signal (or computerize it). Once you do, you will always see a signal when it occurs or the computer will see it for you. Thus, you really will know whether or not you actually knew it all along.

About Van Tharp: Trading coach, and author Dr. Van K. Tharp, is widely recognized for his best-selling book Trade Your Way to Financial Fre-edom and his outstanding Peak Performance Home Study program - a highly regarded classic that is suitable for all levels of traders and investors. You can learn more about Van Tharp at www.iitm.com.

Judgmental “Heuristics” Or Biases and Developing Your Trading System, Part One.

At any given instant, over two billion bits of information impinge upon your senses. Yet consciously, we can only process “7 +or - 2 chunks” of information. This tremendous reduction in information necessary to act upon external signals or make decisions is accomplished through various “heuristic” rules or shortcuts.

These rules, which are essential if you are to make any decisions at all, are both a strength and a limitation. They offer strength in that they provide tremendous shortcuts to making decisions. Decision-making would be practically impossible without them. However, they are a major weakness because people are unaware they are even occurring or how much they distort and delete information and bias our decision-making. For example, two such biases that make it difficult for most people even to make money in the markets are the gambler’s fallacy and the tendency to be risky in the realm of losses and conservative in the realm of profits—the opposite of what it takes to become a successful trader.

In this three-part article, we’ll explore several of these biases and how they might affect one’s trading and investing decisions. We will learn about randomness, sampling variability, and data reliability. Today let’s look at randomness and the gambler's fallacy.

The real “secret” to making money in the market has to do with developing an edge in the market by using probabilities and proper money management. Unfortunately, people have trouble distinguishing between luck and skill when it comes to market predictions. We are unable to comprehend the many factors influencing an event as complex as the movement of a market. For example, if we had access to the number of buyers and sellers in the market at a given time plus information about the conviction and capital behind each trade, we would probably find the markets to be very predictable. Thus, any uncertainty you may have about how the market is going to behave at any given time is in you, not in the market. When you accept the fact that uncertainty is in you, rather than in the market, you will suddenly find you have much greater control over your own behavior towards the market. More importantly, you will have much greater control over the process of designing a trading system and greater understanding of how that trading system works.

When you develop a trading system, you are essentially deciding upon a set of judgmental shortcuts to help you make a decision. Yet people are completely unaware of how we make most of our predictions and judgments, let alone any biases in the way we make them. Thus, the process of designing a trading system is replete with error and becomes a very difficult process. In order to simplify the process, traders need to understand the following major factors: randomness, sampling variability, and data reliability.

Randomness. People want to treat the world as if they could predict and understand everything. As a result, one of the most significant biases people have is to seek patterns where none exist and to invent the existence of unjustified causal relationships. Traders don’t want to trade probabilities. They want consistency. For example, people fail to understand that a random sequence can include a long string or what would be called a trend. Instead, they try to understand the “trend” as something that it isn’t, instead of accepting that such phenomena occur.

Understanding and trading well are not necessarily the same thing. People don’t understand randomness, yet they expect to be able to understand the market. They then build trading systems out of their attempts to understand the market by identifying unjustified causal relationships without ever realizing they are doing it. It is this expectation to understand markets that leads traders to search for “Holy Grail” trading systems that explain the “underlying order” of the markets. There is nothing wrong with building a trading system based on microcosmic glimpses into how the market might work; but you need to know what you’re doing when you’re doing it. You are not trying to understand some mysterious underlying order in the markets. You are developing a set of rules whose long term expectancy gives you an edge in the market, while allowing you to withstand the worst possible catastrophe that could occur in the short term.

For example, many people observe a relationship in the market and assume it explains how the market works.

Jack noticed when a particular pattern occurred in the market, it frequently moved 50 to 100 points higher. He assumed the pattern meant that strong hands were moving into the market. And, when the market didn’t follow the pattern, he became very confused. I said, “How often, when you observe this pattern, does the market move like that?” He responded, “About 35% of the time!” Thus, Jack had simply observed a pattern that was quite profitable 35% of the time. The rest of the time it had no meaning.

A relationship may occur only 35% of the time, and that may be something you can make money with, but it has nothing to do with being right or trying to explain something. What you must learn is that most trading systems come out of observations that have a certain probability of being correct. Those observations do not explain anything. Remember, a trading system is just a set of rules to guide behavior, nothing less or nothing more. Apparent random fluctuations in the market are caused by many more factors than you can possibly monitor in your system.

Develop the attitude of following rules
because they give you an edge in the market.
Avoid the need to understand or explain the market.

Because people attempt to understand and make order out of the market, they assume that the longer a trend continues, the more likely it will suddenly turn around. More importantly, traders are usually willing to bet larger amounts of money on that assumption. Thus, traders want to pick tops and bottoms in a trend—a behavior that tends to be as dangerous as stepping in front of a moving freight train, hoping it will stop and turn around just for you. These biases are usually referred to as the gambler’s fallacy. They have resulted in the ruin of millions of traders over the ages. The gambler’s fallacy is one of those biases, which make trading difficult without a system and proper money management. However, traders frequently develop counter-trend following systems because of this bias—usually with disastrous results.

About Van Tharp: Trading coach, and author Dr. Van K. Tharp, is widely recognized for his best-selling book Trade Your Way to Financial Fre-edom and his outstanding Peak Performance Home Study program - a highly regarded classic that is suitable for all levels of traders and investors. You can learn more about Van Tharp at http://www.iitm.com/.

Tuesday, February 20, 2007

Double the Risk Double the Reward?

If you have a profitable trading system or method that risks, say, 2% of capital per trade based on your entry price and stop loss and makes 30% per year, then why not double this risk level and make twice as much return per year? This seems like a good idea until you think about the fact that doubling the risk does not necessarily mean you will double the return. Why? Here are a couple of things to consider:


Increasing risk per trade increases the risk of total loss. Imagine if your risk was 50% per trade, you would only need to have 2 losing trades in a row to lose 75% of your capital. As your chances of total loss increase, this has the effect of reducing your average ending equity in a simulation of the possible returns from your system and means that doubling up on risk may not double the average return you get.

Winning and losing are not symmetrical. If you lose 50% of your capital you have to have a 100% gain to get back to where you started. If you lose 75% (as in the previous example) then you have to have a 400% gain just to get back to breakeven.

With these examples is obvious that simply increasing risk does not always have a corresponding increase in return, and at some point your risk of ruin goes up significantly – in same cases to almost a certainty. This means you are taking on extra risk to such an extent that you are almost guaranteeing you will lose your capital.

My advice would be to simulate your trading with gradually increasing position sizing and make sure that you are trading at a risk level that does have a corresponding increase in average return that you are comfortable with - otherwise you are simply taking on more risk with little to show for it.


Paul King
PMKing Trading LLC
www.pmkingtrading.com